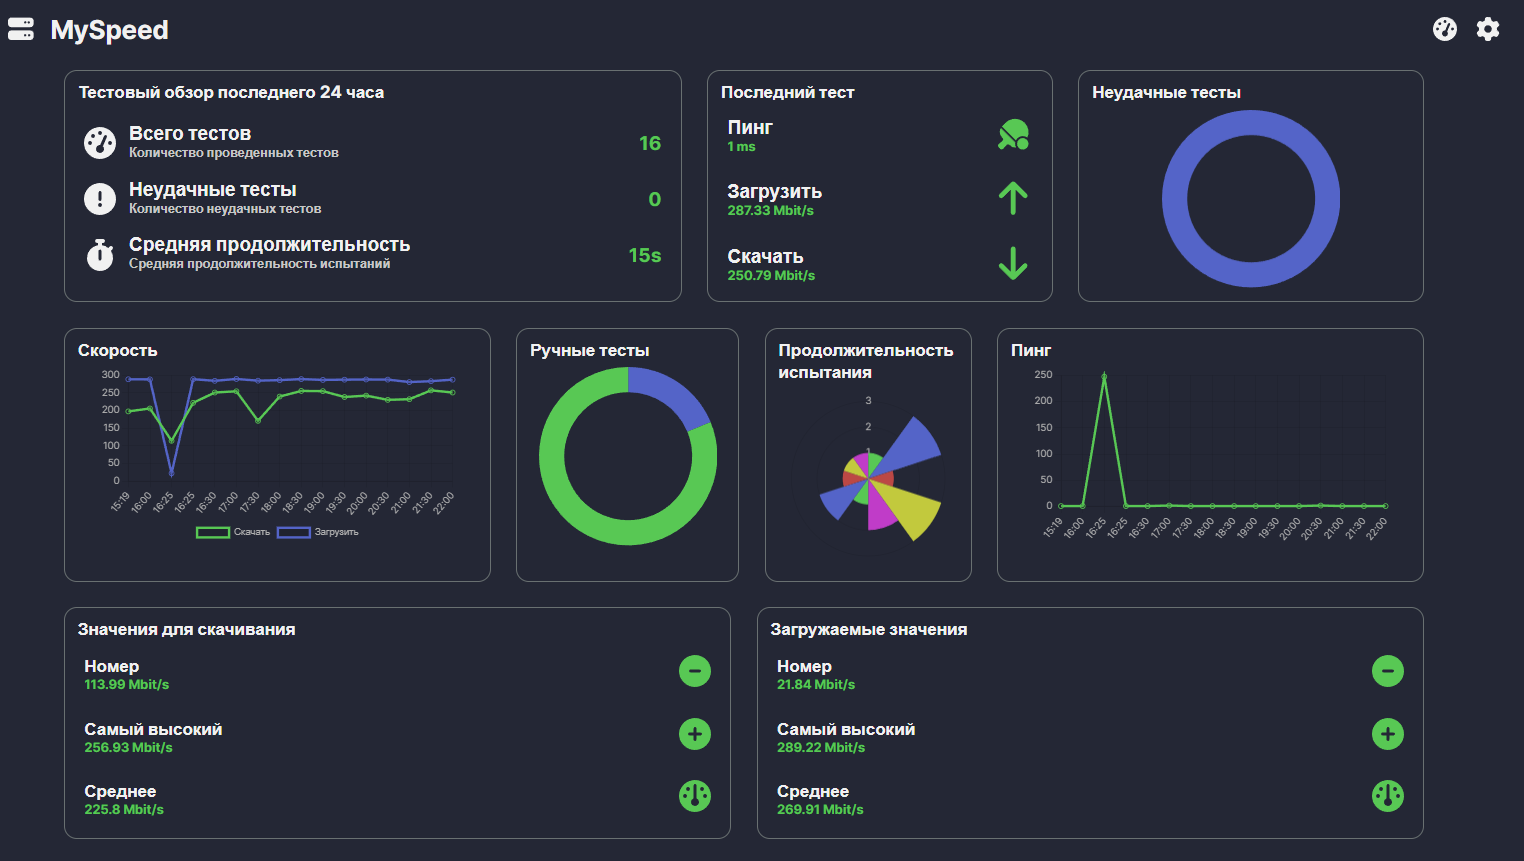
Программа MySpeed предназначена для автоматического измерения скорости интернета с удобной визуализацией и простой настройкой. Имеет простой и красивый дашборд и точку интеграции с prometheus.
Имеет возможность тестировать на основании одного из трех провайдеров:
- Ookla (speed test)
- LibreSpeed
- Cloudflare
Репозиторий: GitHub - gnmyt/myspeed: A speed test analysis software that shows your internet speed for up to 30 days
[!note]
Основным преимуществом по сравнению с тестированием скорости интернета через SpeedTest на базе Home Assistant является несколько другой набор серверов и возможность жесткой настройки сервера тестирования (в Home Assistant сервера плавающие и могут пропадать).
Интерфейс:
Пример docker compose файла:
type: docker-compose
tags:
aliases:
program:
- MySpeed
modified: 2024-10-06T01:01:05+03:00
МОС: “[[Docker Compose]]”
services:
  myspeed:
    image: germannewsmaker/myspeed
    container_name: myspeed
    ports:
      - 5216:5216
    volumes:
      - myspeed:/myspeed/data
    restart: unless-stopped
    networks:
      - monitoring
volumes:
  myspeed: {}
networks:
  monitoring:
    name: monitoring
    external: true
Настройка мониторинга через Prometheus
Добавить в конфигурационный файл Prometheus новую задачу сбора данных:
#myspeed
  - job_name: 'myspeed'
    scrape_interval: 1m # Je nach Testzeitraum anpassen
    scrape_timeout: 8s
    metrics_path: /api/prometheus/metrics
    static_configs:
      - targets: ['myspeed:5216']
Метрики prometheus доступны по умолчанию в api по адресу /api/prometheus/metrics и не требуют дополнительных настроек.
Мониторинг в Grafana
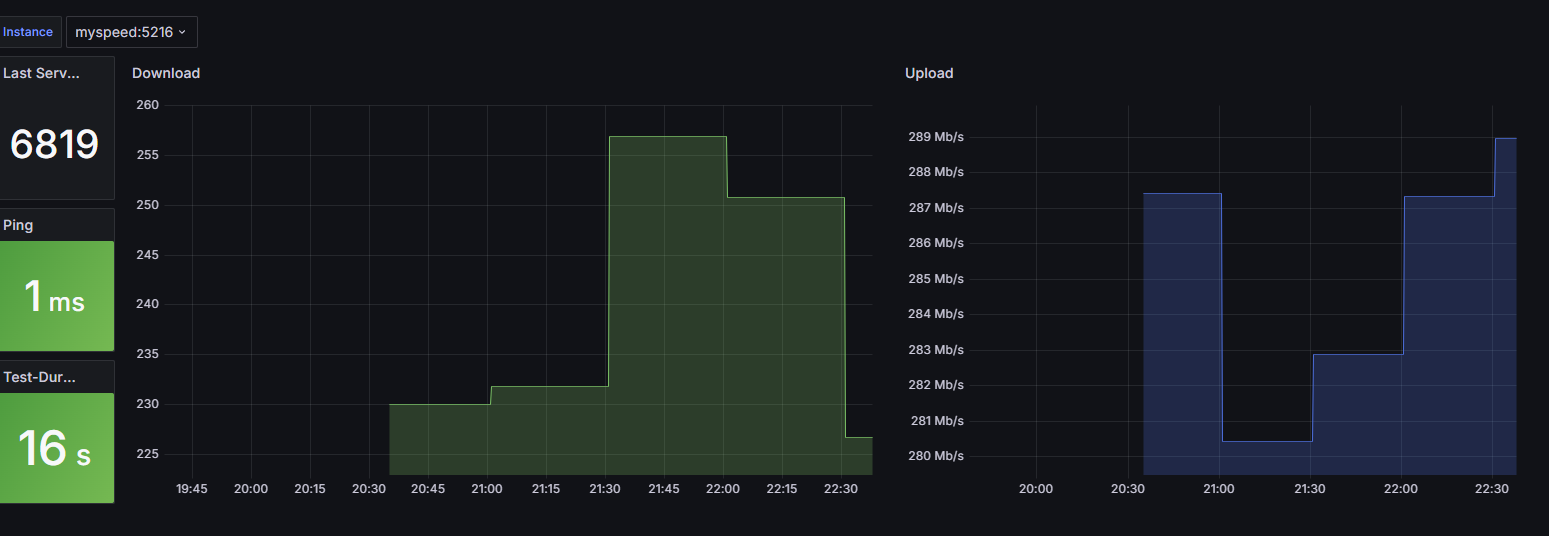
Можно использовать следующий дашборд для Grafana:
{
  "__inputs": [
    {
      "name": "DS_PROMETHEUS",
      "label": "Prometheus",
      "description": "",
      "type": "datasource",
      "pluginId": "prometheus",
      "pluginName": "Prometheus"
    }
  ],
  "__elements": {},
  "__requires": [
    {
      "type": "grafana",
      "id": "grafana",
      "name": "Grafana",
      "version": "11.1.3"
    },
    {
      "type": "datasource",
      "id": "prometheus",
      "name": "Prometheus",
      "version": "1.0.0"
    },
    {
      "type": "panel",
      "id": "stat",
      "name": "Stat",
      "version": ""
    },
    {
      "type": "panel",
      "id": "timeseries",
      "name": "Time series",
      "version": ""
    }
  ],
  "annotations": {
    "list": [
      {
        "builtIn": 1,
        "datasource": {
          "type": "grafana",
          "uid": "-- Grafana --"
        },
        "enable": true,
        "hide": true,
        "iconColor": "rgba(0, 211, 255, 1)",
        "name": "Annotations & Alerts",
        "type": "dashboard"
      }
    ]
  },
  "editable": true,
  "fiscalYearStartMonth": 0,
  "graphTooltip": 0,
  "id": null,
  "links": [],
  "panels": [
    {
      "datasource": {
        "type": "prometheus",
        "uid": "${DS_PROMETHEUS}"
      },
      "fieldConfig": {
        "defaults": {
          "mappings": [],
          "thresholds": {
            "mode": "absolute",
            "steps": [
              {
                "color": "transparent",
                "value": null
              }
            ]
          },
          "unit": "none"
        },
        "overrides": []
      },
      "gridPos": {
        "h": 4,
        "w": 2,
        "x": 0,
        "y": 0
      },
      "id": 5,
      "options": {
        "colorMode": "background",
        "graphMode": "none",
        "justifyMode": "auto",
        "orientation": "auto",
        "percentChangeColorMode": "standard",
        "reduceOptions": {
          "calcs": [
            "lastNotNull"
          ],
          "fields": "",
          "values": false
        },
        "showPercentChange": false,
        "textMode": "auto",
        "wideLayout": true
      },
      "pluginVersion": "11.1.3",
      "targets": [
        {
          "datasource": {
            "type": "prometheus",
            "uid": "${DS_PROMETHEUS}"
          },
          "disableTextWrap": false,
          "editorMode": "builder",
          "expr": "myspeed_server",
          "fullMetaSearch": false,
          "includeNullMetadata": true,
          "instant": false,
          "legendFormat": "__auto",
          "range": true,
          "refId": "A",
          "useBackend": false
        }
      ],
      "title": "Last Server-ID",
      "type": "stat"
    },
    {
      "datasource": {
        "type": "prometheus",
        "uid": "${DS_PROMETHEUS}"
      },
      "fieldConfig": {
        "defaults": {
          "color": {
            "mode": "palette-classic"
          },
          "custom": {
            "axisBorderShow": false,
            "axisCenteredZero": false,
            "axisColorMode": "text",
            "axisLabel": "",
            "axisPlacement": "auto",
            "barAlignment": 0,
            "drawStyle": "line",
            "fillOpacity": 25,
            "gradientMode": "none",
            "hideFrom": {
              "legend": false,
              "tooltip": false,
              "viz": false
            },
            "insertNulls": false,
            "lineInterpolation": "linear",
            "lineWidth": 1,
            "pointSize": 5,
            "scaleDistribution": {
              "type": "linear"
            },
            "showPoints": "auto",
            "spanNulls": true,
            "stacking": {
              "group": "A",
              "mode": "none"
            },
            "thresholdsStyle": {
              "mode": "off"
            }
          },
          "mappings": [],
          "thresholds": {
            "mode": "absolute",
            "steps": [
              {
                "color": "green",
                "value": null
              },
              {
                "color": "red",
                "value": 80
              }
            ]
          }
        },
        "overrides": []
      },
      "gridPos": {
        "h": 12,
        "w": 12,
        "x": 2,
        "y": 0
      },
      "id": 1,
      "options": {
        "legend": {
          "calcs": [],
          "displayMode": "hidden",
          "placement": "right",
          "showLegend": false
        },
        "tooltip": {
          "mode": "single",
          "sort": "none"
        }
      },
      "targets": [
        {
          "datasource": {
            "type": "prometheus",
            "uid": "${DS_PROMETHEUS}"
          },
          "disableTextWrap": false,
          "editorMode": "builder",
          "expr": "myspeed_download{instance=\"$Instance\"}",
          "fullMetaSearch": false,
          "includeNullMetadata": true,
          "instant": false,
          "legendFormat": "__auto",
          "range": true,
          "refId": "A",
          "useBackend": false
        }
      ],
      "title": "Download",
      "transparent": true,
      "type": "timeseries"
    },
    {
      "datasource": {
        "type": "prometheus",
        "uid": "${DS_PROMETHEUS}"
      },
      "fieldConfig": {
        "defaults": {
          "color": {
            "fixedColor": "semi-dark-blue",
            "mode": "fixed"
          },
          "custom": {
            "axisBorderShow": false,
            "axisCenteredZero": false,
            "axisColorMode": "text",
            "axisLabel": "",
            "axisPlacement": "auto",
            "barAlignment": 0,
            "drawStyle": "line",
            "fillOpacity": 25,
            "gradientMode": "none",
            "hideFrom": {
              "legend": false,
              "tooltip": false,
              "viz": false
            },
            "insertNulls": false,
            "lineInterpolation": "linear",
            "lineWidth": 1,
            "pointSize": 4,
            "scaleDistribution": {
              "type": "linear"
            },
            "showPoints": "auto",
            "spanNulls": true,
            "stacking": {
              "group": "A",
              "mode": "none"
            },
            "thresholdsStyle": {
              "mode": "off"
            }
          },
          "mappings": [],
          "thresholds": {
            "mode": "absolute",
            "steps": [
              {
                "color": "green",
                "value": null
              }
            ]
          },
          "unit": "Mbits"
        },
        "overrides": []
      },
      "gridPos": {
        "h": 12,
        "w": 10,
        "x": 14,
        "y": 0
      },
      "id": 3,
      "options": {
        "legend": {
          "calcs": [],
          "displayMode": "hidden",
          "placement": "right",
          "showLegend": false
        },
        "tooltip": {
          "mode": "single",
          "sort": "none"
        }
      },
      "targets": [
        {
          "datasource": {
            "type": "prometheus",
            "uid": "${DS_PROMETHEUS}"
          },
          "disableTextWrap": false,
          "editorMode": "builder",
          "expr": "myspeed_upload{instance=\"$Instance\"}",
          "fullMetaSearch": false,
          "includeNullMetadata": true,
          "instant": false,
          "legendFormat": "{{ instance }}",
          "range": true,
          "refId": "A",
          "useBackend": false
        }
      ],
      "title": "Upload",
      "transparent": true,
      "type": "timeseries"
    },
    {
      "datasource": {
        "type": "prometheus",
        "uid": "${DS_PROMETHEUS}"
      },
      "fieldConfig": {
        "defaults": {
          "mappings": [],
          "thresholds": {
            "mode": "absolute",
            "steps": [
              {
                "color": "green",
                "value": null
              },
              {
                "color": "#EAB839",
                "value": 35
              },
              {
                "color": "red",
                "value": 80
              }
            ]
          },
          "unit": "ms"
        },
        "overrides": []
      },
      "gridPos": {
        "h": 4,
        "w": 2,
        "x": 0,
        "y": 4
      },
      "id": 2,
      "options": {
        "colorMode": "background",
        "graphMode": "none",
        "justifyMode": "auto",
        "orientation": "auto",
        "percentChangeColorMode": "standard",
        "reduceOptions": {
          "calcs": [
            "lastNotNull"
          ],
          "fields": "",
          "values": false
        },
        "showPercentChange": false,
        "textMode": "auto",
        "wideLayout": true
      },
      "pluginVersion": "11.1.3",
      "targets": [
        {
          "datasource": {
            "type": "prometheus",
            "uid": "${DS_PROMETHEUS}"
          },
          "disableTextWrap": false,
          "editorMode": "builder",
          "expr": "myspeed_ping{instance=\"$Instance\"}",
          "fullMetaSearch": false,
          "includeNullMetadata": true,
          "instant": false,
          "legendFormat": "{{ instance }}",
          "range": true,
          "refId": "A",
          "useBackend": false
        }
      ],
      "title": "Ping",
      "type": "stat"
    },
    {
      "datasource": {
        "type": "prometheus",
        "uid": "${DS_PROMETHEUS}"
      },
      "fieldConfig": {
        "defaults": {
          "mappings": [],
          "thresholds": {
            "mode": "absolute",
            "steps": [
              {
                "color": "green",
                "value": null
              },
              {
                "color": "#EAB839",
                "value": 20
              },
              {
                "color": "red",
                "value": 50
              }
            ]
          },
          "unit": "s"
        },
        "overrides": []
      },
      "gridPos": {
        "h": 4,
        "w": 2,
        "x": 0,
        "y": 8
      },
      "id": 4,
      "options": {
        "colorMode": "background",
        "graphMode": "none",
        "justifyMode": "auto",
        "orientation": "auto",
        "percentChangeColorMode": "standard",
        "reduceOptions": {
          "calcs": [
            "lastNotNull"
          ],
          "fields": "",
          "values": false
        },
        "showPercentChange": false,
        "textMode": "auto",
        "wideLayout": true
      },
      "pluginVersion": "11.1.3",
      "targets": [
        {
          "datasource": {
            "type": "prometheus",
            "uid": "${DS_PROMETHEUS}"
          },
          "disableTextWrap": false,
          "editorMode": "builder",
          "exemplar": false,
          "expr": "myspeed_time{instance=\"$Instance\"}",
          "fullMetaSearch": false,
          "includeNullMetadata": true,
          "instant": false,
          "legendFormat": "{{ instance }}",
          "range": true,
          "refId": "A",
          "useBackend": false
        }
      ],
      "title": "Test-Duration",
      "type": "stat"
    }
  ],
  "schemaVersion": 39,
  "tags": [],
  "templating": {
    "list": [
      {
        "current": {},
        "definition": "label_values(myspeed_ping,instance)",
        "hide": 0,
        "includeAll": false,
        "label": "Instance",
        "multi": false,
        "name": "Instance",
        "options": [],
        "query": {
          "qryType": 1,
          "query": "label_values(myspeed_ping,instance)",
          "refId": "PrometheusVariableQueryEditor-VariableQuery"
        },
        "refresh": 1,
        "regex": "",
        "skipUrlSync": false,
        "sort": 0,
        "type": "query"
      }
    ]
  },
  "time": {
    "from": "now-6h",
    "to": "now"
  },
  "timepicker": {},
  "timezone": "browser",
  "title": "MySpeed",
  "uid": "edu0gd3yho6iob",
  "version": 5,
  "weekStart": ""
}
Описание дашборда на официальном сайте: MySpeed | Grafana Labs
[!urls]- Упоминания:
- [[Self-hosting. Prometheus|Prometheus]]
- [[Self-hosting. Grafana|Grafana]]
- [[Self-hosting программы]]
- [[Сервер Monitoring]]
[!description]- Примечание
Примечание:: Тестирование скорости интернета со статистикой и панелью