Сервер оплачен, письмо с рутовым паролем пришло, руки тянутся ставить панель. Стоп. Ровно сейчас у вас есть то, чего не будет через неделю: пустая машина без нагрузки и живое окно возврата — почасовая тарификация или гарантия на несколько дней. На пустой машине измерения честные, а решение «этот сервер не подходит» стоит копейки. Через неделю на нём уже будет нода с пользователями, и вы будете уговаривать себя, что 8 % steal — это нормально.
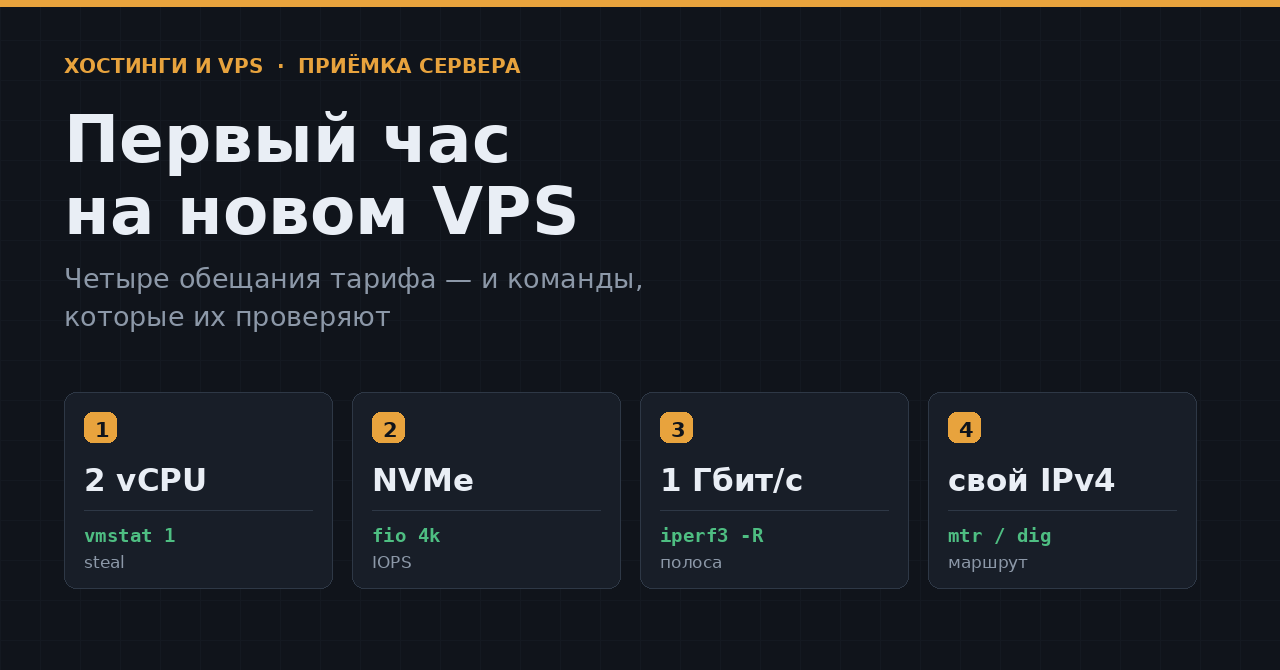
Ниже — четыре обещания, которые вам продали в карточке тарифа, и способ проверить каждое. Суммарно это минут двадцать, если не считать fio.
Все измерения делаются до того, как на сервер поедет боевая нагрузка. Не потому что так аккуратнее, а потому что иначе вы будете мерить сами себя: собственный Xray в фоне даст и steal-подобную картину загрузки, и мусор в выводе iperf3.
Обещание нулевое: что это вообще за машина
Слово «VPS» продаётся и за полноценную виртуальную машину, и за контейнер на общем с сотней соседей ядре. Разница не косметическая: во втором случае половина того, что вы собирались делать, физически недоступна.
systemd-detect-virt
Команда печатает тип виртуализации и завершается с кодом 0, если виртуализация обнаружена, и ненулевым — если машина физическая. kvm — полноценная ВМ. lxc, lxc-libvirt, openvz, podman — контейнер. Если оба слоя вложены, по умолчанию показывается внутренний; развести их помогают --vm и --container.
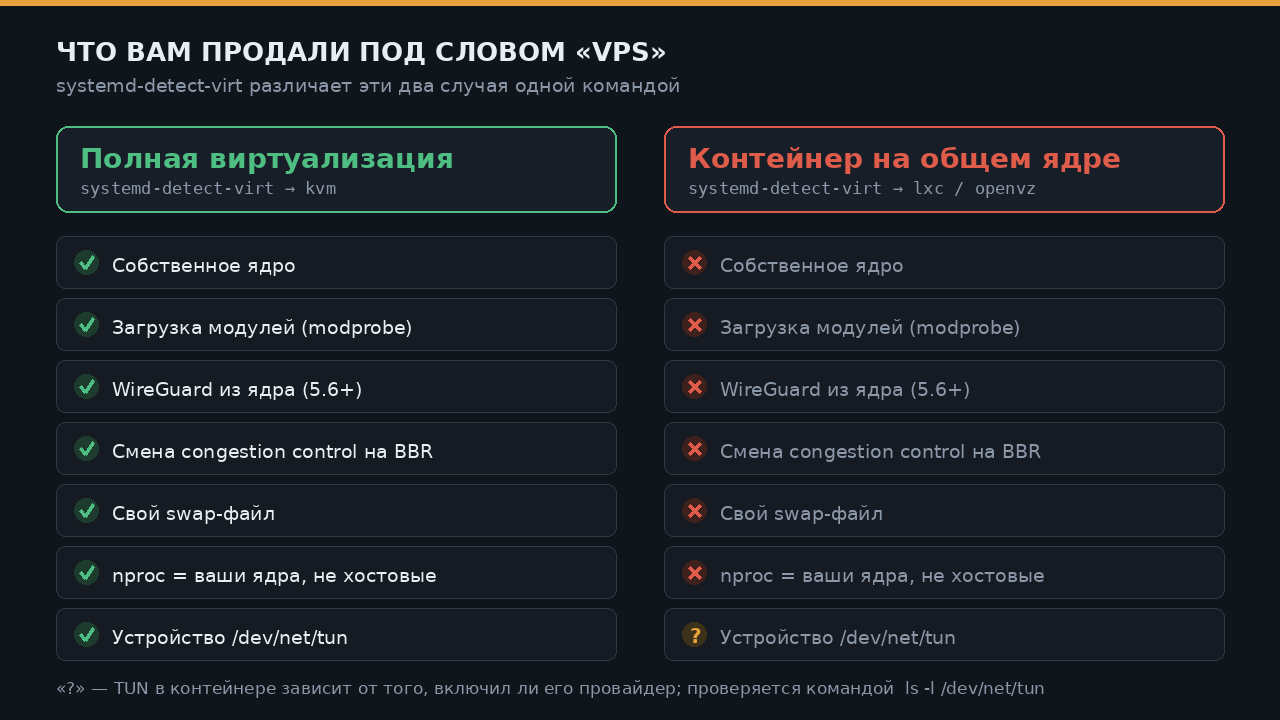
Схема по документации systemd-detect-virt и linuxcontainers.org
Цель LXC, как формулирует её сам проект, — «создать окружение, максимально близкое к обычной установке Linux, но без необходимости в отдельном ядре». Отдельного ядра нет — значит, нет и modprobe. Ядерный WireGuard (в mainline с 5.6) не поднимется, sysctl для сетевого стека либо read-only, либо меняется на всём хосте сразу и вам его менять не дадут, а nproc покажет ядра хоста, а не ваши.
Контейнерный «VPS» — не всегда обман. За 2–3 доллара это честный формат, и для статики, бота или зеркала он работает. Но если вы брали машину под ноду с ядерным WireGuard, под собственный tcp_bbr или под что угодно, требующее модулей ядра, — это не тот товар, и разбираться надо сейчас, а не через месяц.
Заодно посмотрите, что с TUN, — без него не запустится ни один туннель:
ls -l /dev/net/tun
Обещание «2 vCPU»: сколько из них действительно ваши
vCPU — это не ядро, а доля времени на ядре, которую гипервизор вам выделяет. Сколько он у вас отнимает, видно в счётчике steal.
vmstat 1 10
Колонка st в выводе, по определению из man-страницы, — «время, украденное у виртуальной машины» (до Linux 2.6.11 оно вообще не считалось). Первоисточник счётчика — восьмое поле строки cpu в /proc/stat, и документация ядра описывает его коротко: involuntary wait, вынужденное ожидание. Это время, когда ваша задача была готова считать, а физическое ядро в этот момент отдали соседу.
Что видно в st |
Как это читать |
|---|---|
| 0–1 % | Норма. Оверселлинга либо нет, либо соседи спят |
| 2–5 % | Терпимо для веб-сервера, заметно для прокси-ноды с TLS |
| 5–15 % | Ядро поделено плотно; под нагрузкой latency поедет |
| > 15 % устойчиво | Вы платите за долю, которой не получаете |
Пороги — практический ориентир, а не стандарт: никакого «допустимого steal» в документации не существует, и один и тот же процент по-разному ощущается на батч-задаче и на интерактивном трафике. Важнее не число за секунду, а то, держится ли оно десять минут подряд и повторяется ли в разное время суток.
Соседнюю колонку wa (iowait) на виртуалке лучше не воспринимать всерьёз. Документация ядра прямо говорит: «iowait ненадёжен при чтении из /proc/stat» — значение может даже уменьшаться, а на многоядерной машине корректно посчитать его сложно. Диск меряют не по wa, а через fio — об этом ниже.
Для ноды с TLS отдельно проверьте, отдал ли гипервизор аппаратный AES:
grep -o -m1 -E 'aes|avx2' /proc/cpuinfo
openssl speed -evp aes-128-gcm -seconds 3
openssl speed — штатная утилита для замера скорости криптоалгоритмов, -evp гоняет шифр через EVP-интерфейс. Разница между AES-NI и программной реализацией — не проценты, а разы, и на прокси-узле она превращается прямо в потолок по трафику. Если флага aes в /proc/cpuinfo нет, а тариф продавался как «под VPN», это повод для вопроса в поддержку.
Обещание «NVMe»: почему dd тут ничего не измеряет
Классическое «проверил диск через dd, всё быстро» не проверяет диск. dd if=/dev/zero of=test bs=1M count=1024 пишет линейно и в страничный кэш, а на некоторых ФС нули ещё и схлопываются. Получите вы скорость памяти хоста, а не хранилища.
dd, hdparm -t и «скачал файл, скорость хорошая» — это не бенчмарк диска. Ни один из них не создаёт случайной нагрузки с очередью, а именно она убивает СУБД и логи панели. Меряйте fio с --direct=1.
apt install -y fio
fio --name=rr --filename=/root/fiotest --size=1G \
    --rw=randread --bs=4k --iodepth=32 --numjobs=4 \
    --direct=1 --ioengine=libaio --runtime=60 --time_based --group_reporting
rm -f /root/fiotest
Что здесь важно. --direct=1 включает небуферизованный ввод-вывод (O_DIRECT) — запросы идут мимо страничного кэша, и вы видите хранилище, а не память. --bs=4k с --rw=randread даёт случайное чтение блоками по 4 КБ: это профиль базы, а не копирования фильмов. --iodepth=32 держит очередь, --time_based заставляет крутить нагрузку все 60 секунд, даже если 1 ГБ прочитан раньше.
Смотреть в выводе надо на две вещи: IOPS и хвост задержек clat percentiles. Средняя задержка врёт — интересен 99-й процентиль. Диск, который выдаёт хорошие IOPS при p99 в сотни миллисекунд, — это диск, на котором панель будет иногда «задумываться» на глазах у пользователей. Кстати, если вы уже наступали на историю с внезапно кончившимся местом под контейнеры, там причина обычно не в диске: куда на самом деле уходит /var/lib/docker.
Обещание «1 Гбит/с»: до какого именно места
В карточке тарифа написана скорость порта. Порт — это первый метр пути.
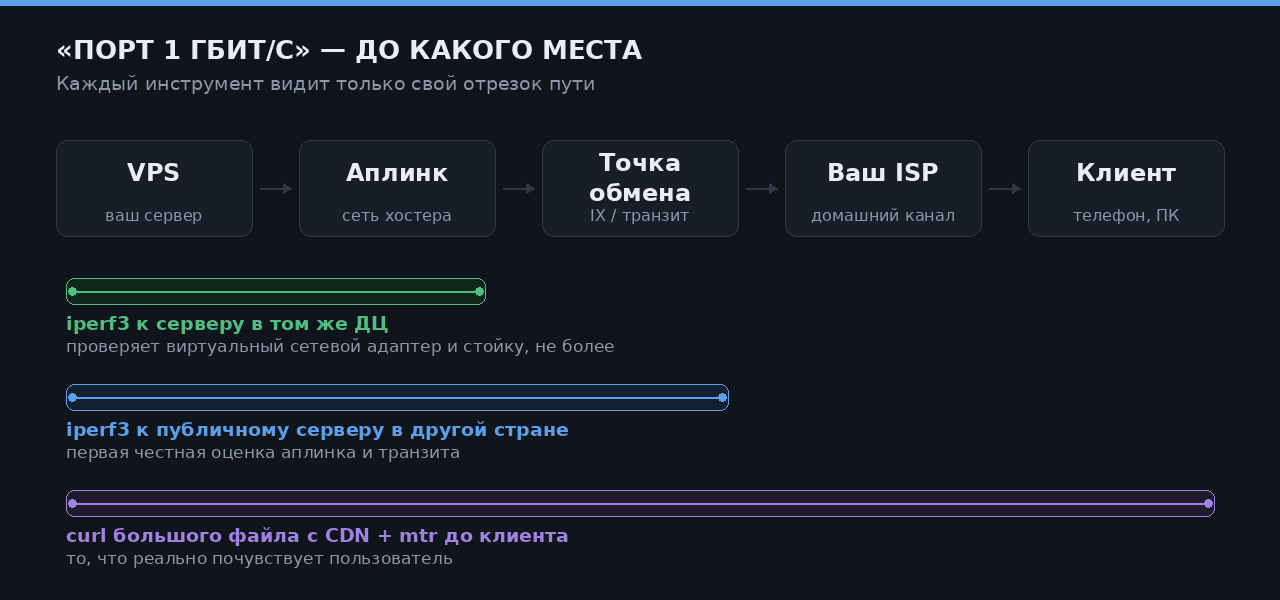
Схема на основе документации iperf3 и практики сетевой диагностики
Тест «скачай наш файл с соседнего сервера», который предлагают многие хостеры, честно показывает, что виртуальный адаптер работает, — и ничего больше. Полезная проверка начинается с публичного iperf3 в другой стране:
apt install -y iperf3
iperf3 -c ping.online.net -p 5200 -t 20        # отдача
iperf3 -c ping.online.net -p 5200 -t 20 -R     # приём (reverse)
Публичные серверы перечислены на iperf.fr, и там же оговорка, которая экономит полчаса недоумения: сервер принимает одно соединение за раз. Занят — берите соседний порт из диапазона или другую площадку. Обязательно гоняйте оба направления: асимметрия «отдаёт на 900, принимает на 80» — типичная картина перегруженного аплинка.
Дальше — маршрут:
mtr -rwzbc 100 1.1.1.1
Потери на промежуточных хопах в mtr сами по себе ничего не значат. Многие маршрутизаторы намеренно занижают приоритет ICMP-ответов в свой адрес — транзитный трафик они при этом гонят без единой потери. Диагноз ставится только по последней строке: если потери есть на пятом хопе и нет на конечном — всё в порядке.
Заодно проверьте MTU, если на сервере будет туннель:
ping -M do -s 1472 1.1.1.1
1472 байта полезной нагрузки плюс 28 заголовков = ровно 1500. Пакет не проходит — MTU на пути меньше, и это будущие зависшие TLS-хендшейки внутри туннеля. У ядра для таких случаев есть net.ipv4.tcp_mtu_probing: по документации, 0 — выключено, 1 — «выключено по умолчанию, включается при обнаружении ICMP black hole», 2 — «всегда включено, начальный MSS берётся из tcp_base_mss».
И проверьте, есть ли вообще выбор алгоритма перегрузки:
sysctl net.ipv4.tcp_available_congestion_control
Документация ядра гарантирует наличие только reno; всё остальное зависит от сборки. Нет bbr в списке и modprobe tcp_bbr не помогает — вернитесь к разделу про виртуализацию, ответ, скорее всего, там.
Обещание «выделенный IPv4»: с какой историей он вам достался
Адрес выделенный — но не новый. До вас на нём кто-то был, и его репутация переезжает к вам вместе с адресом.
dig -x 203.0.113.10 +short
dig +short 10.113.0.203.zen.spamhaus.org
Первая команда показывает PTR: если он остался от предыдущего владельца или его нет вовсе, почта с сервера будет уходить в спам. Вторая — запрос в Zen, где октеты адреса перевёрнуты. Пустой ответ (NXDOMAIN) — адреса в списках нет. 127.0.0.2 — SBL, 127.0.0.3 — CSS, 127.0.0.4 — XBL, 127.0.0.10 и 127.0.0.11 — PBL.
Один код стоит запомнить отдельно: 127.255.255.254 — «запрос через публичный резолвер». Это не «ваш адрес в списке», это отказ обслуживать запрос: Spamhaus не отвечает на DNSBL-запросы, пришедшие через 8.8.8.8, 1.1.1.1 и подобные. Мерьте с резолвера самого хостера или через веб-форму, иначе получите бессмысленный результат и сделаете неверный вывод.
Последнее, что стоит сделать до переноса нагрузки, — проверить доступность адреса из той страны, ради которой сервер и покупался. Свежий IP из «чистой» подсети и IP из подсети, где сосед полгода собирал жалобы, для вас выглядят одинаково, а для сети назначения — нет. Внешние сервисы проверки доступности (тот же check-host.net) отвечают на этот вопрос за минуту, и это ровно та минута, которая отделяет «сервер не подошёл, вернул деньги» от «полгода объясняю пользователям, почему не коннектится».
Минимальный протокол, который стоит прогнать до того, как на машину поедет что-то важное:
systemd-detect-virt— KVM или контейнер;ls -l /dev/net/tunvmstat 1 10десять минут в разное время суток — устойчивыйstgrep -o -m1 aes /proc/cpuinfo+openssl speed -evp aes-128-gcmfioсо случайным чтением 4k и--direct=1— IOPS и p99iperf3в оба направления к серверу в другой странеmtr -rwzbc 100— смотреть последнюю строкуdig -x+ запрос в Zen с резолвера хостера- Доступность адреса из целевой страны
Когда это повод для тикета, а когда — просто данные
Не всё, что вы намерите, — брак. Steal в 3 % на самом дешёвом тарифе — это ровно то, за что вы заплатили; продавать долю ядра дешевле, чем ядро, и никто не обещал обратного. Диск на 20 тысяч IOPS вместо «до 100 тысяч» — тоже штатно, потому что «до» в маркетинге означает пиковое значение хоста, а не ваше.
Тикет имеет смысл писать там, где обещание было конкретным и не выполнено: заявлен KVM — пришёл LXC; заявлен выделенный порт — реальная отдача вдвое ниже в обе стороны и стабильно; заявлен NVMe — задержки как у сетевого HDD. В остальных случаях полезнее не спорить, а положить цифры в заметку: через полгода, когда сервер начнёт тормозить, у вас будет с чем сравнивать. Именно эти цифры отличают «мне кажется, стало хуже» от «p99 вырос втрое с марта».
И да — если сервер брался под панель с нодой, к этому чек-листу естественно пристыковывается развёртывание панели и ноды с VLESS + Reality, а перед правкой конфига пригодятся проверки сайта-донора для REALITY.
Источники
- Linux kernel documentation: /proc/stat — поля строки
cpu, определение steal, ненадёжность iowait - man 8 vmstat — значение колонок
us,sy,id,wa,st - man 1 systemd-detect-virt — типы виртуализации,
--vmи--container, коды возврата - LXC Introduction — «окружение без отдельного ядра»
- fio documentation —
direct,iodepth,time_based,ioengine - openssl speed —
-evp,-seconds,-multi - Kernel: ip-sysctl —
tcp_congestion_control,tcp_mtu_probing - iperf.fr: публичные серверы iperf3
- Spamhaus: DNSBL usage и коды возврата
- WireGuard Installation
А какой замер у вас первым отсеивал плохой сервер? У меня чаще всего это оказывался не steal и не диск, а асимметрия в iperf3: отдача в линию, приём в пол. Интересно, у кого какой критерий «всё, возвращаю» — и были ли случаи, когда провайдер по вашим цифрам реально переселил машину на другой хост.